Mobile App Analytics: Measuring Success and User Behavior
Learn how to implement comprehensive analytics to understand user behavior and make data-driven decisions for your mobile app.

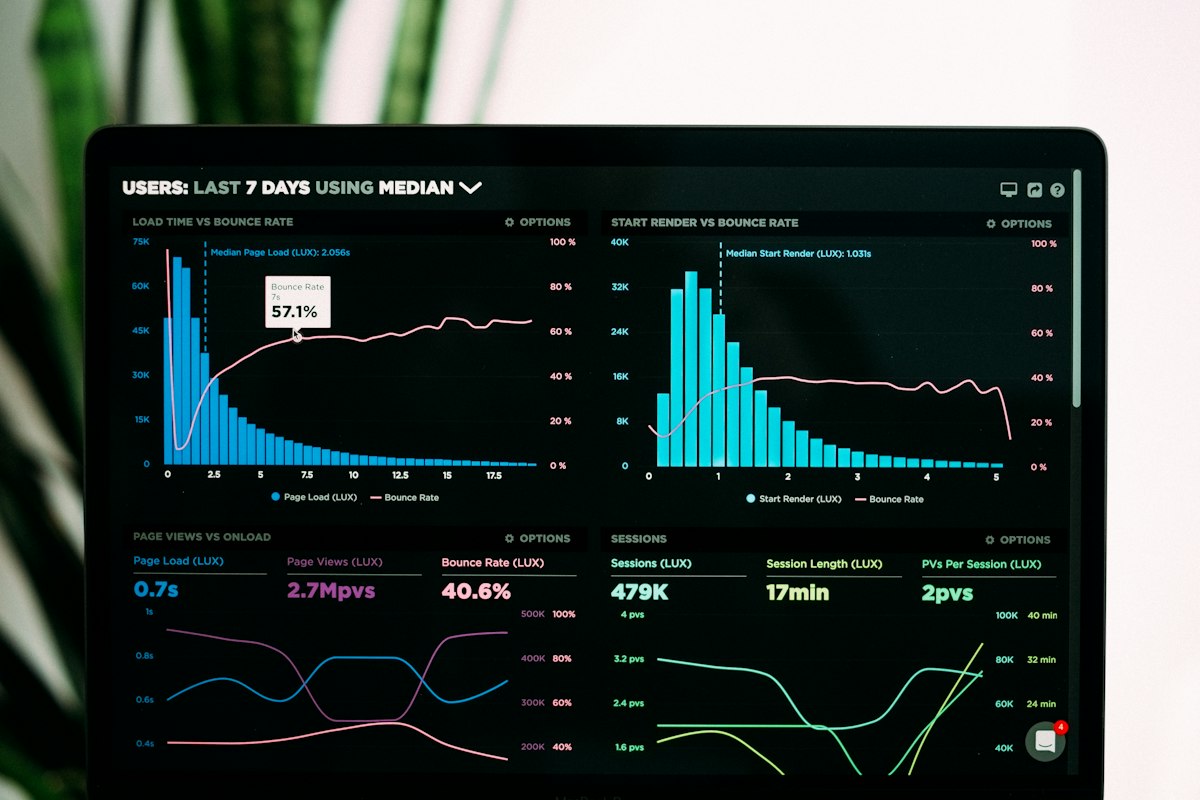
Data-driven decisions are crucial for mobile app success. Here's how to implement and use analytics effectively.
Why Analytics Matter
#
Benefits- Understand user behavior
- Identify pain points
- Measure feature success
- Optimize conversion funnels
- Reduce churn
- Improve retention
- Guide product roadmap
Key Metrics to Track
#
- Identify pain points
- Measure feature success
- Optimize conversion funnels
- Reduce churn
- Improve retention
- Guide product roadmap
Key Metrics to Track
#
1. Acquisition Metrics
- Downloads
- Install source
- Cost per install (CPI)
- Organic vs paid
#
2. Engagement Metrics
- Daily Active Users (DAU)
- Monthly Active Users (MAU)
- Session length
- Session frequency
- Screen flow
- Feature usage
#
3. Retention Metrics
- Day 1, 7, 30 retention
- Churn rate
- Cohort analysis
- Return frequency
#
4. Revenue Metrics
- Average Revenue Per User (ARPU)
- Lifetime Value (LTV)
- Conversion rate
- Purchase frequency
- Cart abandonment
#
5. Performance Metrics
- Crash rate
- App load time
- API response time
- Error rate
- Battery usage
Analytics Platforms
#
Google Analytics for Firebase Pros:
- Free
- Comprehensive
- Google ecosystem integration
- User properties and audiences
Setup: ```javascript // React Native import analytics from '@react-native-firebase/analytics';
await analytics().logEvent('purchase', { item_id: '123', value: 99.99, currency: 'USD' }); ```
#
Mixpanel Pros:
- Advanced segmentation
- Funnel analysis
- A/B testing
- User profiles
Setup: ```javascript import Mixpanel from 'mixpanel-react-native';
Mixpanel.init('YOUR_TOKEN'); Mixpanel.track('Button Clicked', { button_name: 'Sign Up', screen: 'Home' }); ```
#
Amplitude Pros:
- Product analytics focus
- Behavioral cohorts
- Retention analysis
- User paths
#
Segment Pros:
- Single integration, multiple destinations
- Data warehouse sync
- Customer Data Platform
Implementation Best Practices
#
1. Plan Your Events ```javascript // Bad: Generic events analytics.track('button_click');
// Good: Descriptive events analytics.track('checkout_started', { cart_value: 149.99, item_count: 3, currency: 'USD', user_type: 'premium' }); ```
#
2. Track the Funnel ```javascript // User journey analytics.track('app_opened'); analytics.track('product_viewed', { id: '123' }); analytics.track('add_to_cart', { id: '123' }); analytics.track('checkout_started'); analytics.track('payment_info_entered'); analytics.track('purchase_completed', { revenue: 99.99, currency: 'USD' }); ```
#
3. User Properties ```javascript // Set user properties analytics.setUserProperties({ subscription_tier: 'premium', signup_date: '2026-01-01', preferred_category: 'electronics' }); ```
#
4. Screen Tracking ```javascript // React Navigation const routeNameRef = useRef(); const navigationRef = useNavigationContainerRef();
const onReady = () => { routeNameRef.current = navigationRef.getCurrentRoute()?.name; };
const onStateChange = async () => { const previousRouteName = routeNameRef.current; const currentRouteName = navigationRef.getCurrentRoute()?.name; if (previousRouteName !== currentRouteName) { await analytics().logScreenView({ screen_name: currentRouteName, screen_class: currentRouteName }); } routeNameRef.current = currentRouteName; }; ```
Advanced Techniques
#
Cohort Analysis ```sql -- Example query structure SELECT DATE_TRUNC('week', signup_date) as cohort, COUNT(DISTINCT user_id) as users, COUNT(DISTINCT CASE WHEN last_active >= signup_date + INTERVAL '7 days' THEN user_id END) as retained_users FROM users GROUP BY cohort; ```
#
Funnel Analysis ```javascript // Track conversion funnel const trackFunnelStep = (step, properties) => { analytics.track(`funnel_${step}`, { ...properties, funnel_name: 'purchase_flow', timestamp: Date.now() }); };
trackFunnelStep('start', {}); trackFunnelStep('product_select', { product_id: '123' }); trackFunnelStep('cart_add', {}); trackFunnelStep('checkout_start', {}); trackFunnelStep('complete', { revenue: 99.99 }); ```
#
A/B Testing ```javascript import { getRemoteConfig } from '@react-native-firebase/remote-config';
const runABTest = async () => { const config = await getRemoteConfig(); const buttonColor = config.getString('cta_button_color'); analytics.track('ab_test_view', { test_name: 'cta_button_color', variant: buttonColor }); return buttonColor; }; ```
Privacy & Compliance
#
GDPR Compliance ```javascript // Ask for consent const requestAnalyticsConsent = async () => { const consent = await showConsentDialog(); if (consent) { await analytics().setAnalyticsCollectionEnabled(true); } else { await analytics().setAnalyticsCollectionEnabled(false); } }; ```
#
Data Anonymization ```javascript // Remove PII const sanitizeData = (data) => { return { ...data, email: undefined, phone: undefined, name: undefined }; };
analytics.track('event', sanitizeData(userData)); ```
Debugging Analytics
#
Debug Mode ```javascript // Firebase debug mode // iOS adb shell setprop debug.firebase.analytics.app
// Android adb shell setprop debug.firebase.analytics.app
``` #
Validate Events ```javascript const validateEvent = (eventName, properties) => { if (!eventName || typeof eventName !== 'string') { console.error('Invalid event name'); return false; } if (properties && typeof properties !== 'object') { console.error('Invalid properties'); return false; } return true; }; ```
Visualization & Reporting
#
Key Dashboards
1. Overview Dashboard - DAU/MAU - New users - Retention - Revenue
2. User Journey - Entry points - Screen flow - Drop-off points - Conversion funnel
3. Feature Usage - Most used features - Feature adoption rate - Time spent per feature
4. Performance - Crash-free users - App load time - API latency
#
Custom Reports ```javascript // Example: Generate weekly report const generateWeeklyReport = () => { const metrics = { new_users: getNewUsers('week'), active_users: getActiveUsers('week'), retention: getRetention(7), revenue: getRevenue('week'), top_features: getTopFeatures('week') }; sendReport(metrics); }; ```
Acting on Insights
#
1. Identify Drop-offs ```javascript // Find where users leave const dropOffAnalysis = { screen: 'checkout', dropOffRate: 65%, reason: 'Complex payment form', action: 'Simplify form, add guest checkout' }; ```
#
2. Optimize Features ```javascript // Low usage feature const featureAnalysis = { feature: 'advanced_search', usage: '5% of users', issue: 'Hidden in menu', action: 'Promote in main navigation' }; ```
#
3. Improve Retention ```javascript // Retention strategy const retentionStrategy = { day1Retention: 45%, day7Retention: 25%, tactics: [ 'Better onboarding', 'Push notifications', 'Weekly engagement emails' ] }; ```
Tools & Resources
#
Analytics Platforms
- Firebase Analytics
- Mixpanel
- Amplitude
- Segment
- Heap
#
Visualization
- Looker
- Tableau
- Metabase
- Google Data Studio
#
Learning
- Analytics Academy (Google)
- Mixpanel University
- Product Analytics Playbook
Common Mistakes
❌ Tracking too many events ❌ Not defining KPIs ❌ Ignoring qualitative feedback ❌ No action on insights ❌ Poor event naming ❌ Missing user properties ❌ Not tracking errors
Best Practices Checklist
✅ Define key metrics ✅ Plan event taxonomy ✅ Implement gradually ✅ Validate data quality ✅ Respect privacy ✅ Create dashboards ✅ Regular reviews ✅ Act on insights ✅ A/B test changes ✅ Document everything
Conclusion
Effective analytics transform data into actionable insights. By tracking the right metrics, respecting user privacy, and acting on what you learn, you can continuously improve your app and grow your business.
Remember: Analytics are a means to an end. The goal is to build better products that users love.
Start tracking today!